
The current research investigates age-related behavior in digital service usage with a focus on Android app experience, specifically examining the 10 most frequent UX scenarios for different generations. The findings aim to inform banks, fintech companies, retail, and telecom operators about the nuanced preferences of app UX for different generations.
This knowledge will enable the creation of digital experiences that are either universally appealing or tailored to foster loyalty within specific user categories.
Furthermore, we can provide developers of digital services and applications with a comprehensive report, offering detailed insights and actionable recommendations to effectively address the diverse needs of users across various age groups.
Contents
The study App User Reserch: UX for Different Generations focused on understanding how different age groups interact with user interfaces, revealing distinct preferences and challenges that vary significantly across demographics. The research answers the questions:
The study involved applications that utilize the most distinctly different interface implementations of user scenarios:
We excluded services where content is more important than form, such as games, streaming, and news.
One of the key discoveries was the variance in engagement levels among different age groups. Younger users (aged 18-25) demonstrated high engagement with interactive and visually appealing interfaces, whereas older users (aged 55+) showed preference for simplicity and straightforward navigation. This insight is critical for designing age-appropriate user interfaces that cater to the specific needs and preferences of each group.
Accessibility emerged as a significant factor in the user experience for older age groups. The research identified common barriers such as small text sizes, inadequate color contrast, and complex navigation structures that disproportionately affect older users. Addressing these issues is crucial for making technology more accessible to everyone, regardless of age.
Another important finding was the difference in technological adaptation between age groups. Older users were often slower to adapt to new technologies and interfaces, requiring more intuitive design and clearer instructions. On the other hand, younger users were quicker to adapt but also more likely to encounter frustration with interfaces that did not offer immediate familiarity or predictability.
Based on these insights, the research offers several design recommendations to enhance user experience across age groups. These include prioritizing accessibility features, simplifying navigation, and using adaptive design techniques that can dynamically adjust content and interfaces based on the user's age-related preferences and abilities.
Designing for age diversity transforms user interfaces into bridges that connect generations with technology.
Understanding the practical benefits of the Markswebb UX research can dramatically enhance how businesses engage with their diverse customer bases. Here’s how applying these insights can transform your business strategy:
Tailoring UI/UX design to meet the specific needs of different age groups boosts user satisfaction, leading to higher retention rates and increased brand loyalty.
Implementing the research recommendations improves accessibility, making your digital platforms user-friendly for all ages, which is crucial as the global population ages.
By accommodating the preferences of a broader age range, you tap into new demographic segments, expanding your market reach and opening up new revenue streams.
Employing age-diverse design principles sets your products apart from competitors who may not yet prioritize inclusive design, giving you a clear edge in user experience.
Better-designed interfaces reduce the need for customer support, as users of all ages find the technology easier to navigate and less problematic.
Contact us to receive a free public report with all insights.
Research on which interface solutions are effective for young users, middle-aged users, and the older generation.
Our UX research employed a mixed-methods approach, blending qualitative and quantitative techniques to understand diverse user interactions across age groups.
By integrating these methodologies, we gained comprehensive insights into age-specific design preferences, ensuring our recommendations are grounded in solid evidence and real user feedback.
We hypothesized that the experience of generations, significantly different in age from the average user, would also be significantly different. Therefore, we decided to research groups that are as distinct as possible in age and life experience and do not overlap. For each age group, we selected 7–9 active users of digital services with an equal gender ratio.
Participants were given tasks in unfamiliar services with the most distinct interfaces. Each task required similar operations to be performed and explained. We generated hypotheses about task performance patterns in different groups and prepared them for quantitative research. For testing, we used non-moderated mass tests.
We analyzed the results, filtered outliers, and calculated average values. We compared metrics for identical tasks across different age groups to confirm or refute dependencies.
We then described the specifics of addressing UX issues within age groups, identified commonalities, highlighted specifics, and noted exceptions.
The age groups shown in the research can be paralleled with generational cohorts often referenced in UX:
We propose to examine the dependence of UX on age using the example of a user journey in the process of product selection and acquisition. This could be the purchase of a smartphone, selecting a credit card in a bank's app, or choosing a SIM card with a tariff in a mobile operator's app.
This is a universal framework that can be customized for any industry, user segmentation, and business goal. If we represent the entire user journey in steps, we obtain a Customer Journey Map (CJM), as illustrated below.
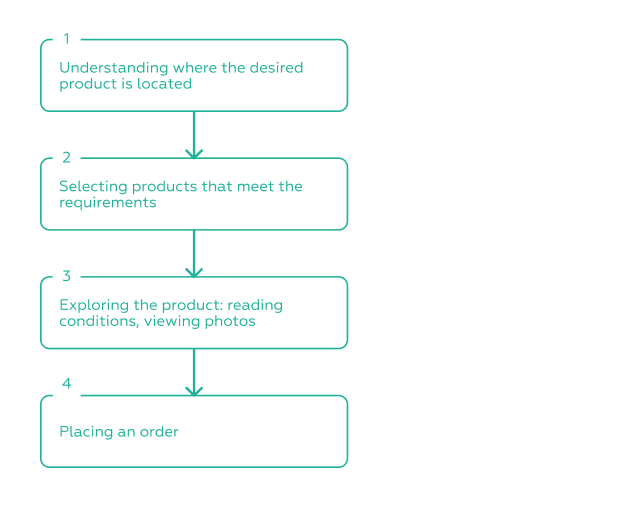
The foundational scenario that underpins the rest. When a user enters an app with a specific goal, the first thing they need to do is understand where to find the necessary interface and how to navigate to it. By navigation, we mean the transitions between screens: this can involve finding a section or a specific entry point in more focused interfaces, such as searching for a prompt.
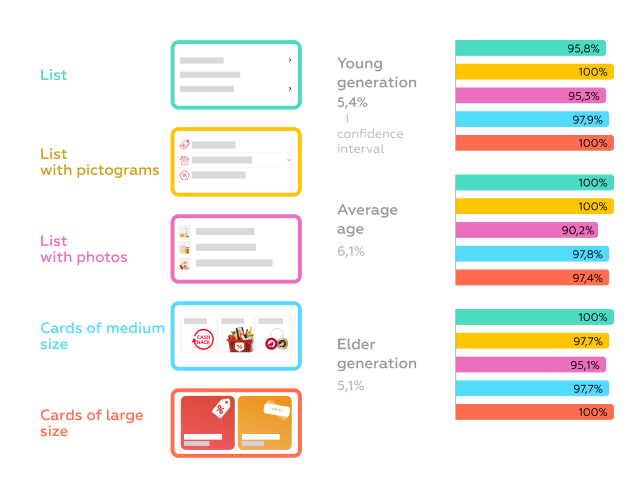
We test the hypothesis "Catalog type influences search efficiency."
The hypothesis has been confirmed, but success is not the only indicator of effectiveness—how much time is required for the search is also crucial.
Taking this into account, catalogs significantly differ in efficiency: Young and middle-aged users find cards of medium size more easily, while a text list showed the lowest efficiency.
Older users showed the same search time in any catalog—whether it had cards or not.
Once the user has entered the relevant category of products, they are presented with a large number of products within that theme. The user has requirements and parameters based on which they select a product, typically including factors like price, rating, color, and material.
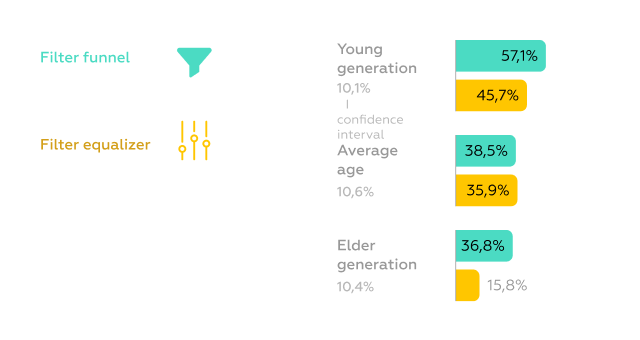
We test the hypothesis "Equalizer filters are less readable than funnel filters for people of all ages." The hypothesis has been confirmed. The difference in recognition is most significant in the older group: 36.8% of respondents recognized the funnel, while only 15.8% recognized the equalizer. Importantly:
The survey situation differs from the actual interface interaction process, where icons are placed not in isolation but in context. How to work with such icons and in what way is reflected in the full report. To obtain it, please contact us.
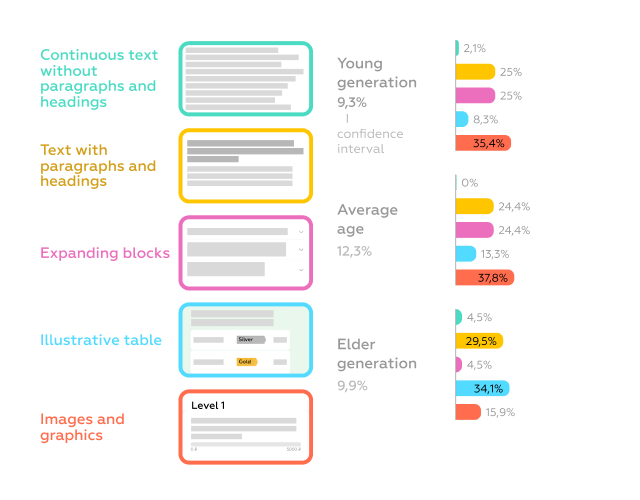
When users select a product, they explore the product's details, review photos, and other detailed information.
We test the hypothesis "Users of all ages are willing to view information in text format." The hypothesis has been confirmed but with refinements:
Similar to navigation, form filling (short and long forms, applications, filling individual fields) is a pervasive scenario for many user tasks.
As long forms consist of multiple steps, and the filling process takes time, the risk of users making mistakes or abandoning the form altogether increases.
We test the hypothesis "The older generation does not read fields with low visual weight."
The hypothesis is partially confirmed: the design of the field affected the search speed in all age groups, and the lower the field is positioned on the screen, the longer it takes to find it. In all groups, a similar trend exists: in two out of three cases, users recognized the input field more slowly—sometimes the difference is up to two times.
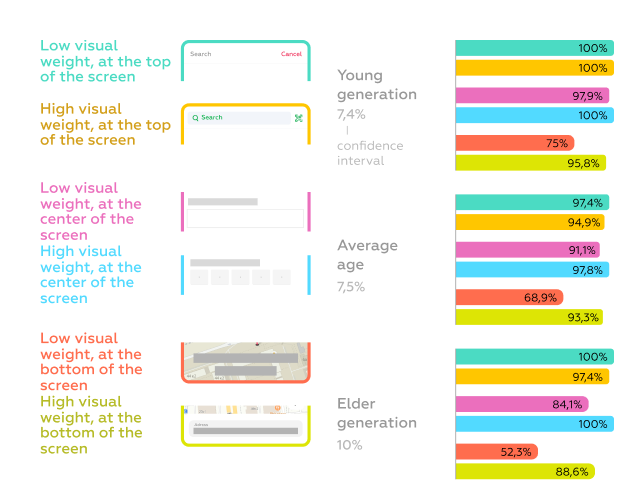
We have identified three aspects in which the perception of interfaces differs among users of different age groups.
Younger users primarily focus on the meaning of symbols and text, while older users prioritize the color of the element. Color has a dominant influence, which becomes particularly critical when it competes with the significance of other elements. In such cases, UX issues may arise, hindering goal achievement for the older user group.
Low digital literacy among the older generation negatively impacts the experience. The older generation is not familiar with interacting with elements like stories and voice assistants. In the examples on the right, the "Next" button and a prominent microphone icon facilitate interaction.
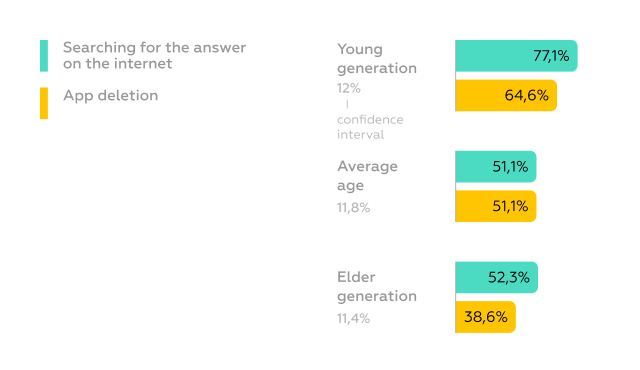
When facing issues, 2/3 of the youth change services or delete channels. Younger users are more radical: 65% of respondents reported that they deleted apps when encountering problems. Older users are much less likely to do so, with only 39% removing apps due to difficulties.
Additionally, in case of issues, the younger generation is significantly more likely to exit the app to search for solutions online. This negative scenario could lead to a user never returning.

Younger users value personalization, while older users prioritize functionality. Appearance appeal of an app is not crucial to users of middle and older generations. Functionality is paramount. The older generation is more tolerant of long loading times and app freezes.
The public free report contains all the insights obtained and answers to questions about how exactly UX is influenced by age. To receive it, please contact us.
App design must strike a balance between new design trends and the timeless principles of user experience design. In designing UX for generational diversity, the ultimate goal is to help users navigate the digital landscape effortlessly, ensuring that each interaction with technology is as enriching as it is efficient. Whether you're designing for Generation Z or aiming to make things simpler for Baby Boomers, your commitment as designers is to create experiences that align with the digital era while respecting the unique needs of each user group.
At Markswebb, we tailor custom projects to each client's unique business needs, analyzing users and competitors, identifying UX issues, and developing strategies to meet complex goals, such as creating leading services. We leverage our expertise in user research methodologies and online analytics, employing design thinking, in-depth interviews, customer journey mapping, and usability testing to set industry standards. Our focus is on creating a digital future that is comfortable, accessible, and engaging for users of all ages, ensuring inclusivity and user satisfaction as we move into 2024.
We’ve evolved dozens of successful financial services and are eager to prove that our expertise can be implemented in other industries and around the world. Have a look at our success stories!
From research and analysis to strategy and design, we help our clients successfully reach their customers through digital services.